Last modified: Jan 31 2026 at 10:09 PM • 7 mins read
Bias / Variance
Table of contents
- Introduction
- Visual Intuition: The Three Classifiers
- Diagnosing Bias and Variance with Error Metrics
- Four Classic Scenarios
- Decision Framework
- High Bias + High Variance: How Is This Possible?
- The Role of Bayes Error
- Summary: Two-Step Diagnostic Process
- Important Caveats
- Key Takeaways
Introduction
Understanding bias and variance is a critical skill that separates good machine learning practitioners from great ones. While the concepts are easy to learn, they’re surprisingly difficult to master - there are nuances that reveal themselves only with experience.
The Deep Learning Era Shift
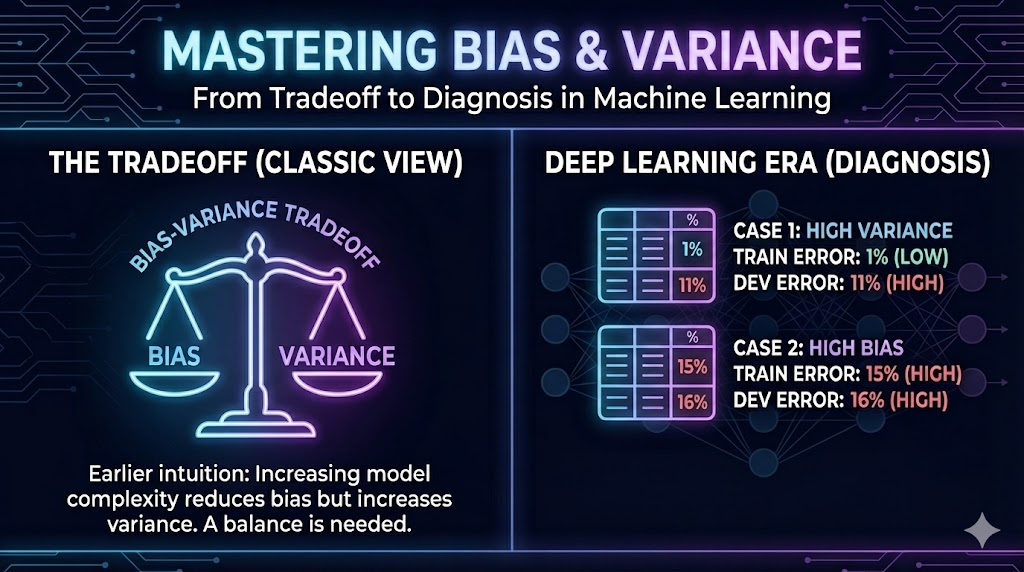
In traditional machine learning, people often discussed the “bias-variance tradeoff” - the idea that reducing bias increases variance and vice versa. However, in the deep learning era:
We still talk about bias and variance, but the tradeoff has become less restrictive.
With modern techniques (more data, regularization, bigger networks), we can often reduce bias without increasing variance, or reduce variance without increasing bias. Let’s explore how to diagnose and fix these issues.
Visual Intuition: The Three Classifiers
2D Classification Example
Consider a binary classification problem with features $x_1$ and $x_2$:
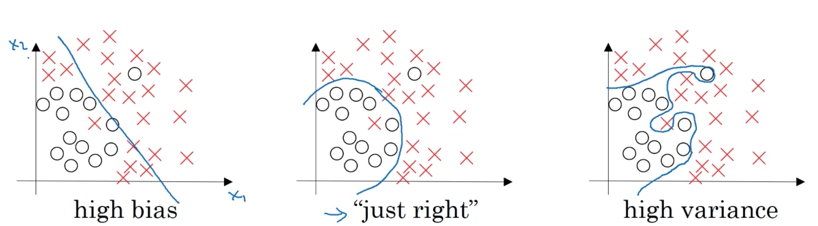
Characteristics:
| Classifier Type | Complexity | Fits Training Data | Generalizes Well | Problem |
|---|---|---|---|---|
| High Bias | Too simple (e.g., linear) | ❌ No | N/A | Underfitting |
| Just Right | Appropriate | ✅ Yes | ✅ Yes | None |
| High Variance | Too complex | ✅ Yes | ❌ No | Overfitting |
The Challenge in High Dimensions
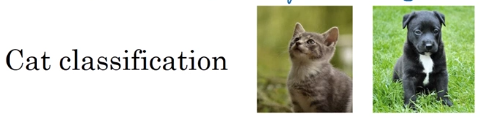
In 2D, you can visualize the decision boundary and see bias/variance issues directly. But in high-dimensional problems (e.g., cat classification with millions of pixels), you can’t plot the data.
Solution: Use quantitative metrics instead of visual inspection.
Diagnosing Bias and Variance with Error Metrics
The Two Key Numbers
To diagnose bias and variance, compare these errors:
- Training set error: How well does your model fit the training data?
- Dev set error: How well does your model generalize to new data?
Assumptions for This Analysis
Important: This analysis assumes that human-level performance (or Bayes error) is nearly 0%.
For tasks like recognizing cats in clear photos, humans achieve ~0% error. We’ll discuss more complex cases later.
Four Classic Scenarios
Scenario 1: High Variance
| Metric | Value | Interpretation |
|---|---|---|
| Training error | 1% | Excellent fit to training data |
| Dev error | 11% | Poor generalization |
| Diagnosis | High Variance | Overfitting |
Analysis:
- Model performs well on training set (1% error)
- Performance degrades significantly on dev set (11% error)
- Gap of 10% indicates the model memorized training data rather than learning general patterns
Visual analogy: This is like the rightmost plot - the complex, wiggly decision boundary.
Scenario 2: High Bias
| Metric | Value | Interpretation |
|---|---|---|
| Training error | 15% | Poor fit even to training data |
| Dev error | 16% | Slightly worse on dev set |
| Diagnosis | High Bias | Underfitting |
Analysis:
- Model can’t even fit the training set well (15% error)
- Dev set performance is only slightly worse (16% error)
- Small gap (1%) means model is consistently underperforming
- Model is too simple to capture underlying patterns
Visual analogy: This is like the leftmost plot - the straight line that doesn’t fit the data.
Scenario 3: High Bias AND High Variance (Worst Case!)
| Metric | Value | Interpretation |
|---|---|---|
| Training error | 15% | Poor fit to training data |
| Dev error | 30% | Much worse on dev set |
| Diagnosis | High Bias + High Variance | Worst of both worlds |
Analysis:
- Model doesn’t fit training data well (15% error) → High bias
- Model generalizes even worse (30% error) → High variance
- This happens when the model is wrong in multiple ways
How is this possible? See the next section for explanation.
Scenario 4: Low Bias AND Low Variance (Ideal!)
| Metric | Value | Interpretation |
|---|---|---|
| Training error | 0.5% | Excellent fit to training data |
| Dev error | 1% | Excellent generalization |
| Diagnosis | Low Bias + Low Variance | Optimal performance |
Analysis:
- Model fits training data nearly perfectly (0.5% error)
- Model generalizes well (1% error)
- Small gap (0.5%) indicates good generalization
- This is your goal!
Decision Framework
Here’s a quick decision tree for diagnosis:
\[\begin{align} \text{Training error high?} &\implies \text{High Bias (Underfitting)} \\ \text{Dev error ≫ Training error?} &\implies \text{High Variance (Overfitting)} \\ \text{Both conditions true?} &\implies \text{High Bias + High Variance} \\ \text{Both conditions false?} &\implies \text{Low Bias + Low Variance (Good!)} \end{align}\]Concrete Thresholds (Cat Classification Example)
Assuming human-level performance ≈ 0%:
| Training Error | Dev Error | Dev - Train Gap | Diagnosis |
|---|---|---|---|
| < 2% | < 3% | < 1% | ✅ Low bias, low variance |
| < 2% | > 5% | > 3% | ⚠️ Low bias, high variance |
| > 5% | Similar to train | < 1% | ⚠️ High bias, low variance |
| > 5% | Much higher | > 5% | 🚫 High bias, high variance |
High Bias + High Variance: How Is This Possible?
2D Example (Appears Contrived)
Imagine a classifier that is:
- Mostly linear (underfits most of the data) → High bias
- Extremely flexible in some regions (overfits noise/outliers) → High variance
Characteristics:
- Linear portion underfits the quadratic shape (high bias)
- Small wiggles overfit individual noisy examples (high variance)
- Needs a smooth quadratic curve, not a linear function with bumps
Why This Matters in High Dimensions
While this 2D example might seem contrived, in high-dimensional problems this is quite common:
Example: Image classification
- Model might be too simple for certain features (underfitting face detection) → High bias
- Model might be too complex for other features (overfitting background patterns) → High variance
- Different parts of the input space can have different bias/variance characteristics
In neural networks:
- Early layers might underfit (high bias)
- Later layers might overfit (high variance)
- Different neurons can specialize in different ways
The Role of Bayes Error
What is Bayes Error?
Bayes error (or optimal error) is the best possible error rate achievable by any classifier, even with infinite data. It represents irreducible error due to:
- Label noise (mislabeled examples)
- Overlapping classes (impossible to distinguish)
- Information loss (insufficient features)
- Inherent randomness
When Bayes Error Affects Your Analysis
Standard assumption: Bayes error ≈ 0% (humans can perform the task perfectly)
But what if the task is inherently difficult?
Example: Blurry image classification
If images are so blurry that even humans can only achieve 15% accuracy:
| Metric | Value | Standard Analysis | Corrected Analysis |
|---|---|---|---|
| Bayes error | 15% | (Assumed 0%) | (Actual) |
| Training error | 15% | High bias? | Actually optimal! |
| Dev error | 16% | High bias? | Low bias, low variance |
Key insight: Compare your errors to Bayes error, not to 0%.
Practical Implications
When Bayes error is significant:
\[\text{Bias} = \text{Training error} - \text{Bayes error}\] \[\text{Variance} = \text{Dev error} - \text{Training error}\]Example with Bayes error = 15%:
Training error: 15%, Dev error: 16%
- Bias = 15% - 15% = 0% (low bias!)
- Variance = 16% - 15% = 1% (low variance!)
We’ll cover this in more detail in later lessons on human-level performance.
Summary: Two-Step Diagnostic Process
Step 1: Check Training Error (Measures Bias)
\[\text{Training error vs Bayes error} \implies \text{Bias assessment}\]- Training error close to Bayes error: Low bias ✅
- Training error much higher than Bayes error: High bias ⚠️
Step 2: Check Dev Error Gap (Measures Variance)
\[\text{Dev error vs Training error} \implies \text{Variance assessment}\]- Small gap (< 1-2%): Low variance ✅
- Large gap (≫ 2%): High variance ⚠️
Combined Diagnosis Table
| Train Error | Dev - Train Gap | Diagnosis | Action Needed |
|---|---|---|---|
| Low | Low | ✅ Good model | Deploy! |
| Low | High | 🟡 High variance | More data, regularization |
| High | Low | 🟡 High bias | Bigger model, more features |
| High | High | 🔴 Both problems | Address bias first |
Important Caveats
This analysis assumes:
- ✅ Bayes error is small (task is feasible)
- ✅ Train and dev sets drawn from same distribution (no distribution shift)
If either assumption is violated, you need more sophisticated analysis (covered in later lessons).
Key Takeaways
- Critical skill: All great ML practitioners deeply understand bias and variance
- Two metrics: Training error and dev error tell you everything you need
- High bias (underfitting): Model too simple, can’t fit training data well
- High variance (overfitting): Model too complex, doesn’t generalize to dev set
- Both possible: High-dimensional models can have high bias AND high variance
- Training error: Measures how well you fit the data (bias indicator)
- Dev-train gap: Measures how well you generalize (variance indicator)
- Bayes error matters: Compare to optimal error, not always 0%
- Blurry images: When task is inherently hard, Bayes error is high
- Distribution assumption: Train and dev must be from same distribution
- No more tradeoff: Deep learning can reduce both bias and variance
- Visual intuition: Linear = high bias, wiggly = high variance, smooth curve = just right
- High-dim complexity: Bias/variance can vary across different input regions
- Diagnostic first: Always diagnose before trying to fix